
The USDA Plant Zone Hardiness Zone Map is an important garden reference to anyone who gardens in the continental United States, Alaska, Hawaii or Puerto Rico.
The U.S. Department of Agriculture (USDA) today released a new version of its Plant Hardiness Zone Map (PHZM), updating this valuable tool for gardeners and researchers for the first time since 2012. USDA’s Plant Hardiness Zone Map is the standard by which gardeners and growers can determine which plants are most likely to thrive at a location. The new map—jointly developed by USDA’s Agricultural Research Service (ARS) and Oregon State University’s (OSU) PRISM Climate Group—is more accurate and contains greater detail than prior versions.
It is available online at https://planthardiness.ars.usda.gov/. In addition to the map updates, the PHZM website was expanded in 2023 to include a “Tips for Growers” section, which provides information about USDA ARS research programs of interest to gardeners and others who grow and breed plants.
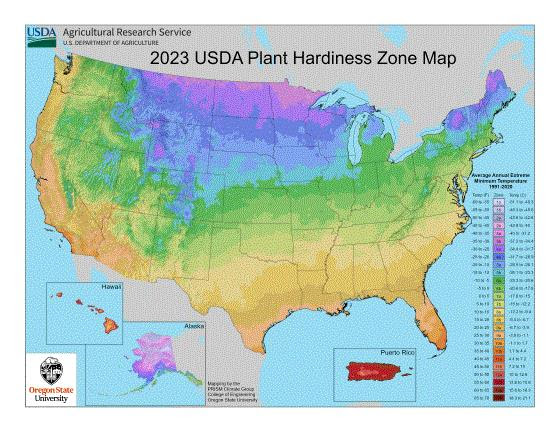
The 2023 map is based on 30-year averages of the lowest annual winter temperatures at specific locations, is divided into 10 °F zones and further divided into 5 °F half-zones. Like the previous map issued in 2023, the new web version offers a Geographic Information System (GIS)-based interactive format and is more user-friendly, including several new, significant features and advances.
The 2023 PHZM is now available as a premier source of information that gardeners, growers and researchers alike can use. A paper version of the 2023 map will not be available for purchase; instead, anyone may download and print copies as needed.
Plant hardiness zone designations represent what’s known as the “average annual extreme minimum temperature” at a given location during the past 30 years. They do not reflect the coldest it has ever been or ever will be at a specific location. It simply records the average lowest winter temperature for the location over a specified time. Low temperature during the winter is a crucial factor in the survival of plants at specific locations.
The map has 13 zones across the U.S. and its territories. Each zone is broken into half zones, designated as “A” and “B.” For example, zone 7 is divided into 7a and 7b half zones. Compared to the 2012 map, the 2023 version reveals that about half of the country shifted to the next warmer half zone, and the other half of the country remained in the same half zone. That shift to the next warmer half zone means those areas warmed somewhere in the range of 0-5 °F. Also, some locations experienced warming in the range of 0-5 °F without moving to another half zone.
 Posted in
